

Financial and housing markets are still trying to sort out the banking crisis and have we seen the last Fed rate hike of this cycle. These events lowered mortgage rates last week and increased purchase application data, but decreased housing inventories.
Here’s a quick recap of the past week:
- The 10-year yield had a Lord of the Rings battle at a key technical level that pushed mortgage rates down over the weekend with no real pause in the bond market.
- active inventory fell 1,109, And new listings data showed a handsome return week-over-week, but there was still a noticeable decline year-over-year.
- Purchase applications rise for third week in a row as rates decline, snapping back three weeks of negative data we’ve seen since rates rose 5.99% To 7.10%,
10 year yield and mortgage rates
Over the past week, I’ve watched the bond market attempt to break below a critical level that I’ve dubbed Gandalf’s line in the sand where the 10-year yield will not pass. To Gandalf’s credit, he managed to hold off the Balrog for another week. As you can see in the chart below, the lower black line associated with the 3.37% rate has been difficult to break.
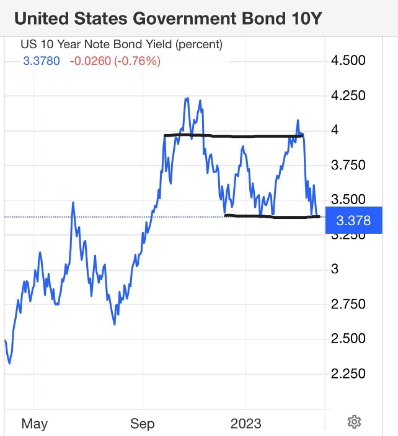
In these crazy days in the financial markets, I stress folks, it is not important how the trading day goes; This is the last closing number. Like magnets, the 10-year yield has tried to break below this critical level several times over the past five months, only to shoot back up to close at a level that won’t warrant a pass.
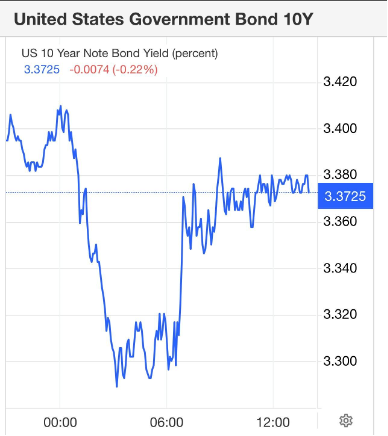
As you can see in the chart below, this played out again on Friday when bond yields fell hard during early trading hours, only to close back down on that line.

In any case, mortgage rates were 6.75% on March 21 and 6.38% on March 24; recent highs were 7.10%, If the mortgage market wasn’t so stressed, mortgage rates should be lower 5.99% Today. In a regular market, they would be closer to 5.25%. federal Reserve has left the housing market orphaned in the rain with no homes to go to because there isn’t much inventory, so the markets are wild up and down.
In my 2023 forecast, I said that if the economy remains stable, the 10-year yield should be in the range between 3.21% and 4.25%Equal to 5.75% To 7.25% mortgage rates. If the economy weakens and we see a rise in jobless claims, the 10-year yield should move lower as well. 2.73%, to translate 5.25% mortgage rates, This assumes that the spreads are wide, as the mortgage-backed securities market is still very stressed.
And now we have a new variable, a banking crisis that the Fed and some others believe could tip the economy into a sharp recession, which the Fed has been pushing for for some time. In some ways, the banking crisis helps the Fed do its job because aggressive rate hikes have been unpopular and the Fed has broken up the regional banking system and now some global banks are in trouble as well.
With this new variable, I’m looking at the economic data differently to see if we get the credit contraction that the Fed wants to see to prevent inflation, or if they have the money to keep the banking crisis at bay. tools so that the economy can expand, making their fight against inflation difficult. We’ll look at the data each week to determine the answer.
weekly housing list
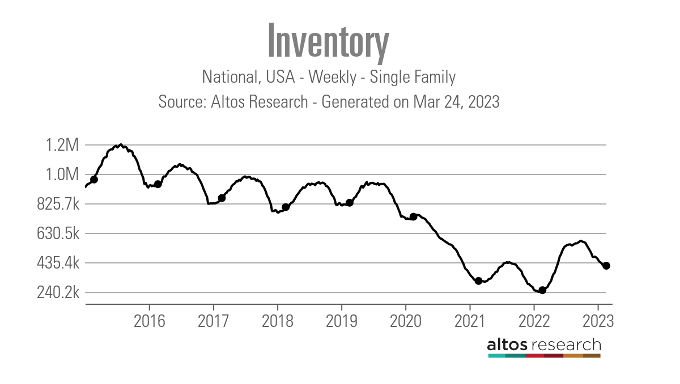
looking at the Altos Research data from last week, the big question is whether we are finally starting to see a seasonal increase in spring inventories. Last week I expected a slight increase in inventory to be the start of a spring increase, but this week we saw a slight decline.
- Weekly Inventory Change (March 17 – March 24): Fell from 414,278 To 413,169
- rose from: same week last year (March 18 – March 25) 245,776 To 251,522
- was down for 2022 240,194
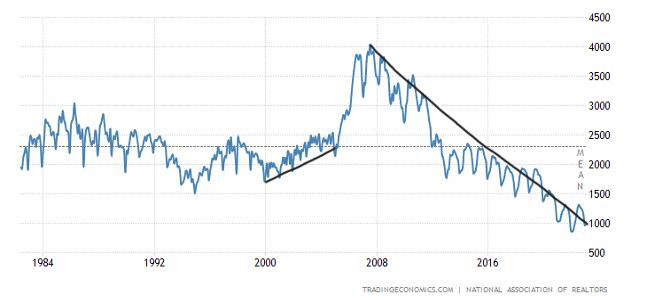
As you can see from the chart below, we are far from the normal levels in the previous extension.

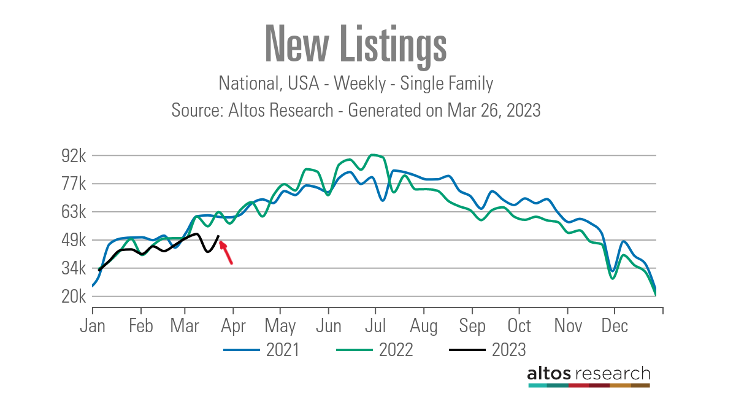
The one piece of good news last week was that new listings data, which showed a significant drop two weeks ago, rebounded excellently to return to the general trend. I was hoping that the new listings data for the week was just a blip in the data line and not a more significant trend of new listings falling, and that seems to be the case now.
That makes me very happy because the last thing the housing market needs is for the new listing data to drop more than it has this year. Of course, new listings data tends to be down year-over-year, but last week’s surge made me feel much better about the year. This was the weekly listing data during the COVID years:
- 2021: 60,177
- 2022: 62,548
- 2023: 50,800

Compare that weekly listing data with pre-COVID-19 levels:
- 2015: 108,685
- 2016: 76,109
- 2017: 79,676
As you can see, we had more new listing data then, even though mortgage rates were higher than they were in 2021.
Last week’s current home sales report from NAR surprised many people except me for the big rebound in sales. That report showed no inventory growth and we are still below 1 million active listings.

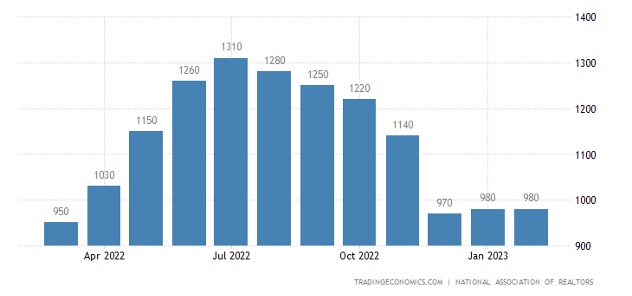
So we have the biggest drop in one year sales in history and a significant jump in sales for one month. Over the course of this period – 2022 to 2023 – here is where we are at total inventory levels: 980,000far from the historical norms of 2 million to 2.5 million.

buy app data
We had another positive print on purchase application data, up 2% week-over-week. We had three weeks of negative data when mortgage rates went from 5.99% to 7.10% and now we have three weeks of positive purchase application data.
Overall, since November 9, 2022, there has been more positive than negative data in procurement applications that I talked about cnbc Last week.

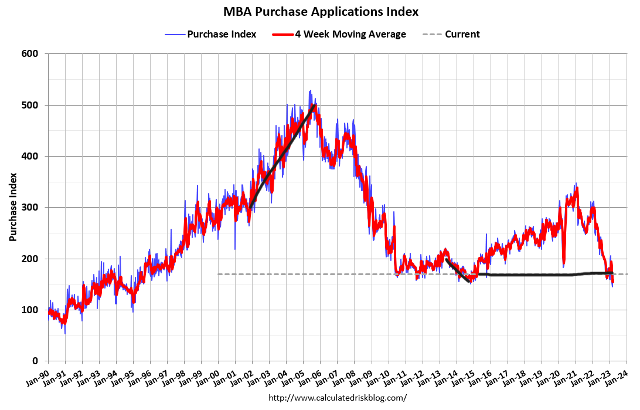
Since we have a shallower bar in this data line, it tends to be very sensitive to rates, and mortgage rates were much higher than what we were accustomed to in the last decade, where we had a range between 3.25%-5%,
Imagine the housing market if rates were in the low 5% range for a long period of time and not this wild Mr Toad ride we see. Outside of that, it’s hard to find a mortgage rate shock like last year’s, when rates jumped from 3% to 7.37%. What happened last year will go into the record books.
week ahead
Of course, all eyes are on the financial markets and what might come out of the woodwork next.
As I write this on Sunday night there are reports first citizen bank will be the buyer of Silicon Valley Bank, I’ll be monitoring the 10-year yield closely to see if we can break that Gandalf line in the sand or if it will turn upside down like in the past. Remember to focus on closing the 10-year yield versus intraday trading actions.
We don’t have much economic data this week, but the home price report comes out on Monday and pending home sales on Tuesday. Pending home sales data may reflect some negative three weeks of purchase apps, when mortgage rates moved from 5.99% to 7.10%.
Also, later this week, I’ll be writing an article on how to view housing economics if the Fed finds a job-loss recession and how and why we shouldn’t compare it to the 2008 period or the COVID-19 recovery period. Should do I can already see some people making the same mistakes they made during the COVID-19 recession.
Some members of the Federal Reserve are discussing a recession due to the banking crisis, so it’s time to discuss what housing would look like if that happened. For this week, keep an eye on the closing of financial markets and bond yields. If we see some weakness in pending home sales, it will be related to the timing of the rate hike.
As always, one day, one week at a time, we’ll look ahead, not back, with this housing market tracker.