

After poor forecasts for the housing market over the winter, the housing market has caught up again this spring, with home prices increasing month-on-month for the third month in a row in April, according to S&P CoreLogic Case-Shiller National Home Price Index, which released on Tuesday. This increase has come after seven consecutive months of decline.
Thank you for reading this post, don't forget to subscribe!“The index tracks price changes in the months of February, March and April of 2023, and highlights the growing number of buyers coming to terms with higher rates and looking for a path towards home ownership,” George Ratiu, chief economist keep current, said in a statement. “Inflation has been a major concern for most consumers over the past year, even as price increases have eased significantly. Also, households have noticed that interest rates drive up the cost of borrowing for credit cards, auto loans and home mortgages. At the same time, the official end of the pandemic signaled a return to a new normal, encouraging Americans to embark on the next phase of their lives.
On a monthly basis, the national index was up 1.3% in April. However, on a year-on-year basis, the index was down 0.2% compared to an annual increase of 0.7% in March.
“The US housing market continued to strengthen in April 2023,” said Craig Lazzara, managing director of . S&P DJI, said in a statement. “Home prices peaked in June 2022, declined till January 2023 and then started a correction.”
Similar to March, both the 10-city and 20-city composite price indices posted yearly declines but monthly gains. For the 20-city aggregate, after seasonal adjustment, 17 out of 20 cities reported lower prices in the year ending March 2023 compared to the year ending April 2023. Boston, San Francisco and Cleveland all saw modest increases of 0.1%, 0.1%. and 0.9% respectively.
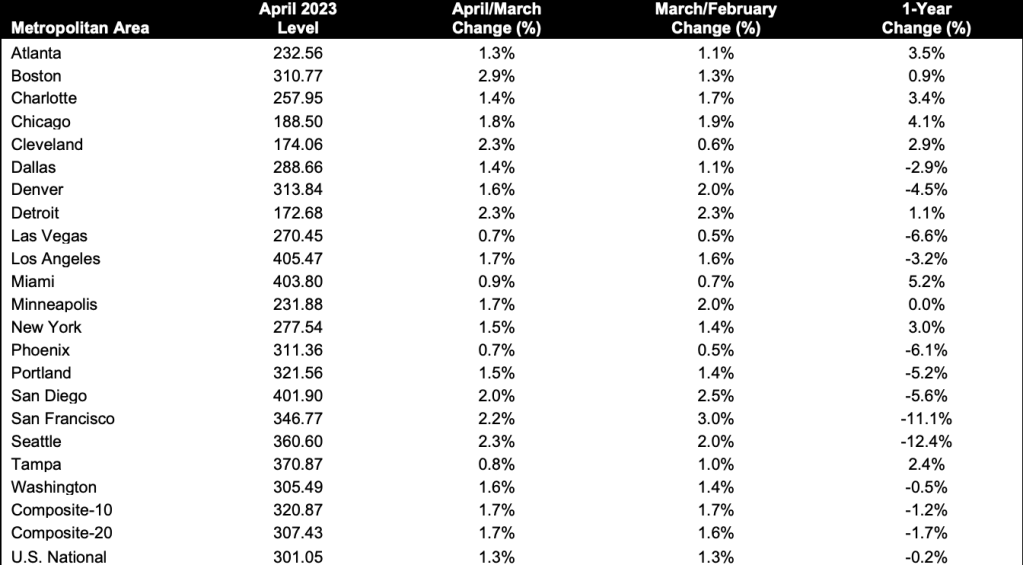
Data till April 2023
Miami once again topped the list with the highest annual price increase of 5.2%, with Chicago (4.1%) and Atlanta (3.5%) rounding out the top three.
“At the other end of the scale, however, the worst performers are all in the Mountain or Pacific time zones, with Seattle (-12.4%) and San Francisco (-11.1%) at the bottom,” Lazzara said. “The southeast (+3.6%) remains the country’s strongest region, while the west (-6.9%) remains the weakest.”
Overall, the 20-city index was down 1.7% on a yearly basis but up 1.7% on a monthly basis, while the 10-city index fell 1.2% year-on-year and rose 1.7% month-on-month.
“If I were trying to make the case that the decline in home prices that began in June 2022 was almost certain to end in January 2023, April’s data would strengthen my argument,” Lazzara said. “Whether or not we see further support for that outlook in the coming months will depend on how well the market responds to the challenges posed by current mortgage rates and the continued prospect of economic weakness.”