Spring housing market music is playing, and application data and active listing inventory rose together last week. The fear of not increasing inventory this spring should be put to rest. The other focus should be on where mortgage rates go; Last week only a little happened.
Here’s a quick recap of the past week:
- Active inventories rose 8,260 week over week, down slightly from last week’s gain, but I’m not complaining — anything positive is on the plus side.
- Purchase application data increased 5% weekly, maintaining a streak of more positive data than negative for the year.
- Mortgage rates, once again, didn’t move much last week; The bottom was 6.50%, while the top was 6.67%; We ended the week at 6.59%.
weekly housing list
Since new listing data was trending at an all-time low in 2023, some feared we wouldn’t see the usual spring inventory growth. After the past few weeks, we can put that fear aside: We’re finally getting a seasonal increase in active listings. One thing that is different about this year is that it took the longest time in history to achieve the seasonal bottom in inventories, but better late than never.
Since 2020, the seasonal inventory bump has occurred later than usual—not until March or April. I reviewed the reasons for this in a February HousingWire Daily podcast. Now that I believe seasonal inventory is down, we can focus on the next step: tracking weekly data on how much inventory growth we can get this year before seasonal inventory begins to decline. .
- Weekly Inventory Change (April 21-28): Inventory increased 414,010 To 422,270
- Same week last year (April 22-April 29): Inventory increased from 271,510 To 287,821
- was down for 2022 240,194
- 2023 is the peak so far 472,680
- For reference, the active listings for this week in 2015 were 1,070,493
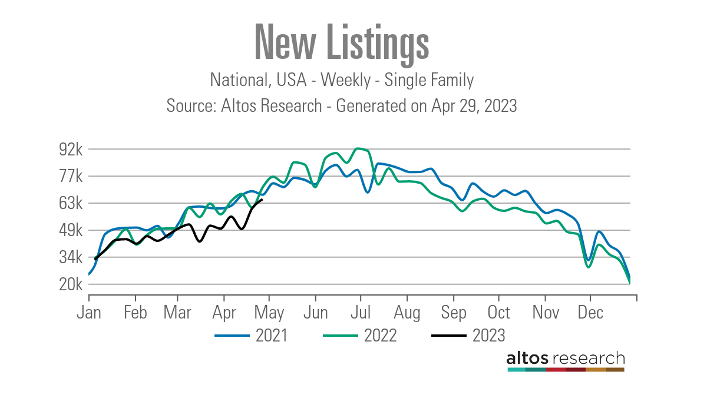
New listing inventory hasn’t come back since last year’s big mortgage rate spike and we’re trending toward an all-time low in 2023. Even though it appears that 2023 will see the lowest new listing data ever recorded in history, we are seeing a traditional increase in new listing data for the year, which is a huge positive in my eyes.
We have to remember that a traditional seller is usually also a traditional buyer, so new listings heading toward their seasonal peak throws cold water on the idea that no one will list their homes because they already have them. Have a low mortgage rate (mortgage rate lockdown principle). ,
New Listing:
- 2021: 67,137
- 2022: 71,023
- 2023: 64,769
For some historical perspective on when housing inventory levels were normal, here are the weekly new listing numbers for 2015-2017:
- 2015: 86,902
- 2016: 80,940
- 2017: 87,327
As you can see in the chart below, the new listings data is highly seasonal, so we don’t have much time left before we see a seasonal decline in the data line.
Male Data from past decades shows just how difficult it has been for 2020 to get anything back to normal on the active listing side. 4 million, We had high inventory levels while the unemployment rate was still excellent in 2007. This proves that the massive supply growth we saw from 2005-2007 was due to credit stress, not because the economy was in recession; America didn’t go into recession until 2008.
Total NAR Inventory Still 980,000, As you can see in the chart below, there is a big difference between these two very different historical housing economic cycles.
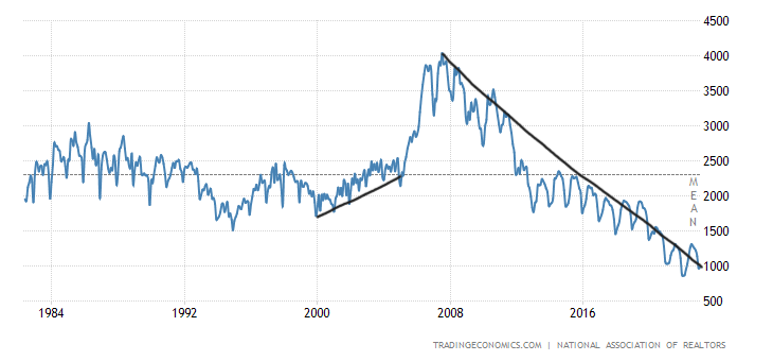
People often ask me why there is such a difference in NAR data versus Altos Research inventory data. This link explains the difference and is worth a read.
Finally, the key observation I’m seeing with this year’s versus last year’s inventory data is that last year’s new listing data was higher than it was in 2021. Also, this week 2022 had a higher volume of active listings, even though we were dealing with one. lower level. It shows me that while active inventory is growing, we’re not seeing the same growth this year as last year. This could change as spring inventory increases are still early, but that’s the big difference I’m seeing right now.
10 year yield and mortgage rates
Last week, mortgage rates didn’t change much, which may seem strange considering another bank, first republic, Was headed for failure. The market is now a bit calmer than before Silicon Valley Bank failed, is evident from how the stock and bond markets traded last week.
The rate of inflation growth from the PCE data released on Friday morning was not a big deal in my view, it is very similar to services inflation recently, but PCE growth for the 12 months would be below 4%. When that happens, fears of a 1970s inflation break should be put to rest.
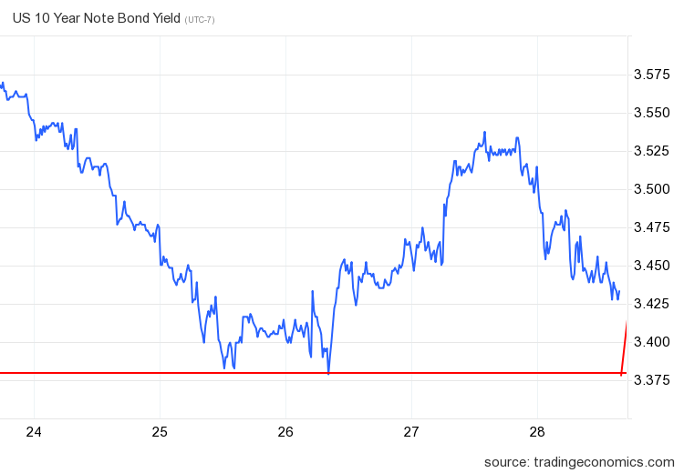
New home sales beat estimates, while pending home sales declined month over month. The 10-year yield tested the Gandalf line once again, only to bounce from that level and go back up towards the end of the week.
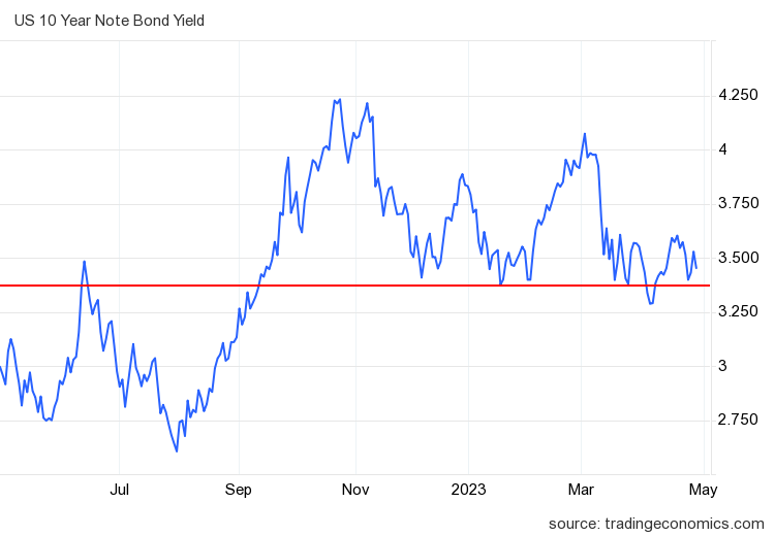
In my 2023 forecast, I said that if the economy remains stable, the 10-year yield should be in the range between 3.21% and 4.25%Equal to 5.75% To 7.25% mortgage rates. If the economy weakens and we see a significant increase in jobless claims, the 10-year yield should drop as low as 2.73%, to translate 5.25% mortgage rates,
Of course, the banking crisis has taken a new turn this year. However, even with this, the labor market, while softening, has not yet broken.
As you can see in the chart below, the 10-year yield has stayed in its stable economic range 100% of the time. We can also see how difficult it has been for the 10-year yield to break through 3.37% -3.42% field with any confidence. Mortgage rates have been in the middle 5.99% – 7.10%,
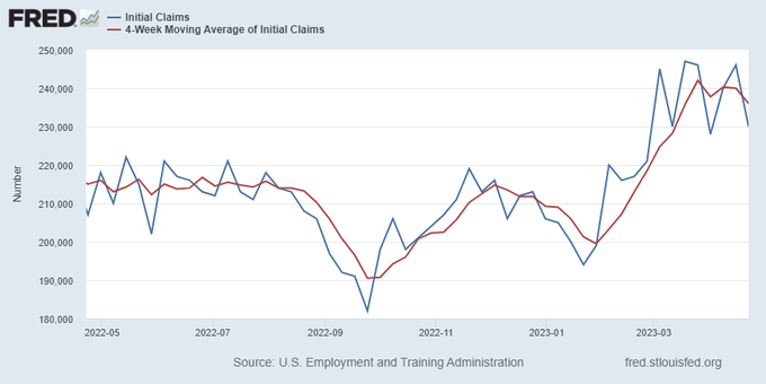
My line in the sand for Fed Pivot has always been 323,000 On the four week moving average. This has been my big economic data line for the cycle ever since August 5th, 2022 raised my sixth and final bearish red flag. While the labor market is getting less tight, it’s not broken yet.
From the Labor Department: “Initial claims for unemployment insurance benefits fell by 16,000 to 230,000 in the week ended April 22. The four-week moving average fell to 236,000.”
buy app data
Purchase application data has been the main stabilization data line for housing since November 9, 2022, with 16 positive prints versus six negative prints, after making some holiday adjustments to the data line. For 2023 we have nine positive prints versus six negative prints. This data line has been very sensitive, and we are working from the lowest bar ever recorded in this index. This past week we saw a 5% week-over-week increase in the data line.
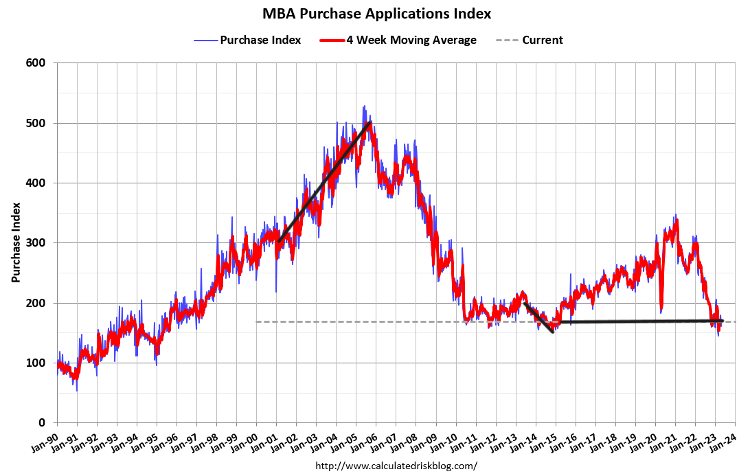
The year-over-year decline in procurement application data was 28%, the smallest year-over-year decline since September of 2022. However, the data will improve independently from year to year, even if the data is flat for the rest of the line. of the year.
The year-over-year compass will be much easier as the year progresses, especially in the second half. This data line looks at 30-90 days for sales, and we’re almost done with the seasonality of this data line. I always weigh this report from the second week of January to the first week of May. Traditionally after May, the volume would drop; This has not been the case after 2020.
After May, I would address this issue with seasonality and a potential growth push at the end of the year, as seen in previous years.
Week Ahead: Jobs and the Fed
It’s Jobs & Fed week; Jobs data is one economic data line the Fed is looking to slow down. not only do they want to look at the unemployment rate 4.5%-4.75%, They also want to see wage growth slow even further. This week we have Job Openings Report, ADP Jobs Report, Jobless Claims and Friday’s BLS Jobs Report.
If economic data softens on the labor front, it could be a big week for mortgage rates and the bond market. Already, we see a slowdown in the labor market, but it’s not fast enough for the Fed.
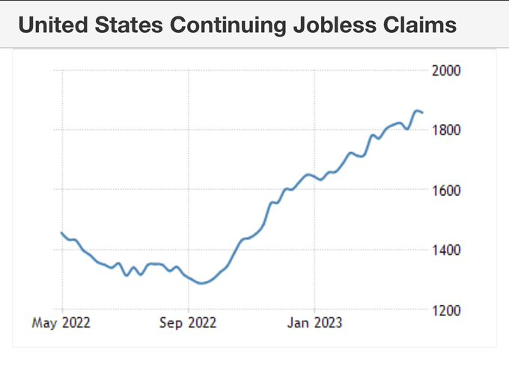
Claims have been rising steadily for some time, meaning the labor market is not tight enough for these Americans to find work quickly after filing for unemployment benefits.
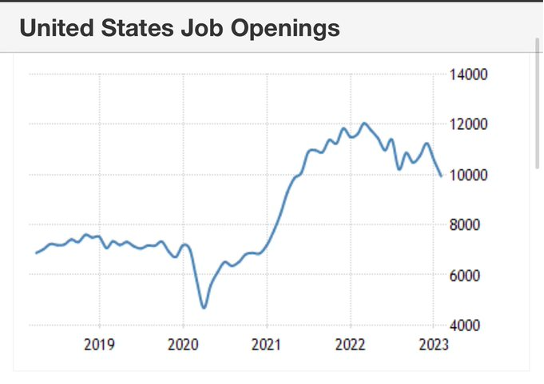
Job opportunities up to 12 million in 2022 down from 10 million now. We’re still at historic highs here, but the labor market is getting less tight. Reaching 10 million job opportunities in the early stages of recovery was a big challenge for me.
To me, the one data line that shows we don’t have the inflation of the 1970s is the wage-growth data associated with the BLS Jobs Report. As I wrote in a previous jobs report, we have a tight labor market but it’s cooling down.
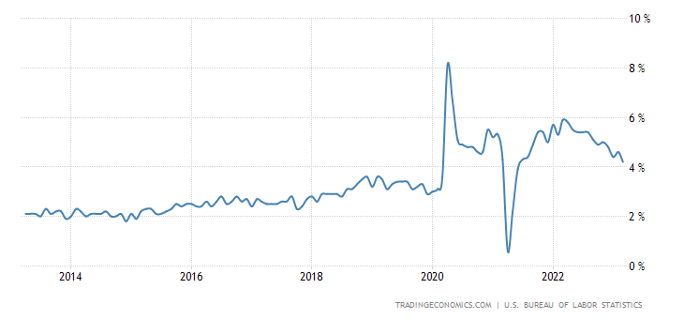
The Fed is also meeting this week and markets have already braced for a quarter-percent rate hike; This will happen when the government will find a buyer for another bank on life support.
With Fed meetings, it’s not so much their words as their actions. Since the Fed has now publicly stated that it believes there will be a recession later this year, based on their models, their actions during the downturn matter more than what remains to be done here. I believe the discussion around the Fed should be right here as this could be the last rate hike of the cycle.
So, there are plenty of juicy economic data lines for us to keep an eye on in the week ahead, as for me the housing market moves in line with the 10-year yield this year; When it goes down, the market functions better, and when it goes up, demand softens.


